Project portfolio representation
Large corporations often struggle to represent their huge projects portfolio in a structured and readable manner.
Of course, there are number of ways to present projects portfolio from a performance point of view. SPI, for example, is comparing the earned value to the planned value displaying along the projects maturity. CPI does the same comparing the earned value to the actual cost. Others are trying to highlight the projects dependencies in order to represent the portfolio's complexity linking graphically the projects together. Others represent the projects risks highlighting the ones on which management should focus attention.
All these representations are analytical and do not show much about the projects functional impacts.
Grabbed into Back Office and Operational risk from Mervyn J. King, there is another very interesting representation which shows how the corporate strategy is declined into number of projects and how much impacting these projects are:
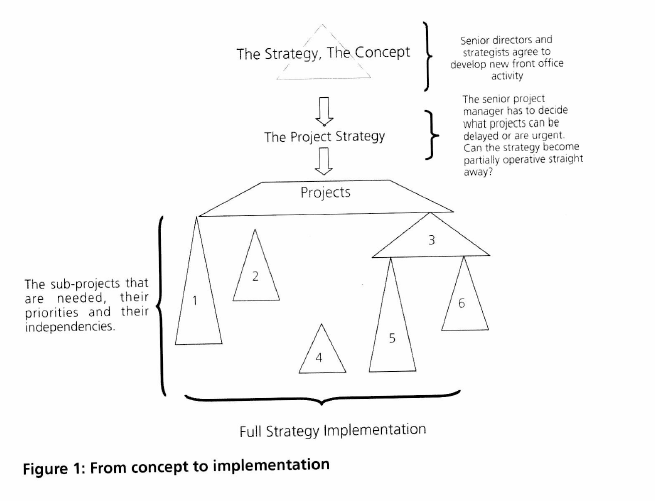
In this representation, it easy to understand which company's areas are impacted and how deeply each project is impacting each department. This view is nicely complementing the other representations mentioned earlier.
Of course, there are number of ways to present projects portfolio from a performance point of view. SPI, for example, is comparing the earned value to the planned value displaying along the projects maturity. CPI does the same comparing the earned value to the actual cost. Others are trying to highlight the projects dependencies in order to represent the portfolio's complexity linking graphically the projects together. Others represent the projects risks highlighting the ones on which management should focus attention.
All these representations are analytical and do not show much about the projects functional impacts.
Grabbed into Back Office and Operational risk from Mervyn J. King, there is another very interesting representation which shows how the corporate strategy is declined into number of projects and how much impacting these projects are:
© Mervyn K. King
In this representation, it easy to understand which company's areas are impacted and how deeply each project is impacting each department. This view is nicely complementing the other representations mentioned earlier.